|
|
Post by canadamike on Apr 21, 2011 2:56:25 GMT -5
Sometimes life is funny.
There is no place on earth that make me feel as good as here, in this apparently virtual world of HG.
But I do not have the luxury of time I used to have. I now make a living out of agriculture and it implies travelling a lot.
A lot, like in ''I am happy I am old enough not to have to take care of childrens anymore''.
But as I am still, despite being far less present here, toying with corn and many other crops, and climate change is now part of my life. I sure would not call it routine, as, here at least, it is far from that. I saw 105 F in 1975, and it was the hottest summer ever then and up to last one, but it was raining almost every night for half an hour, so it was a magical summer for a canadian. But this year it went up to 114 F, no rain, and it was not funny for such an ecosystem.
The last 5 years have seen HUGE periods of rain and cold, to the point I was joking with the people in Fredericton in charge of our little potato genebank about breeding taters for good swimming capabilities.
3 of the last 5 years have seen the usual July ''heat waves'' provide us with 40 F or so nights. 2 summers ago an entire acre of trial fields, filled with Tim Peters perennial wheat and rye, melons, rare corns, heirloom potatoes, rare veggies, all selected for multiplying was drowned under 3 feet of water.
In 2008 the summer was so darn cold that ALL my corns, I am talking many tens of them, from 59 days to 90 days ( sweet corns, about 20 of them) all of them came along together. Forget the difference in tasseling time. »Forget also that some early ones were transplanted, COld is cold, heat is heat, water is water.
We CANNOT, generally speaking,RELY ON DAYS TO MATURITY ANYMORE.
Maybe in some areas it is still viable, but not everywhere, and at least the heat units system is coherent in that chaos.
I suggest we start using it here. Then our experiences in our diverse areas can find some form of coherence. »We would talk the same language.
The chart I just published comes from one of the greatest corn free breeders in the world, Victor Kucyk, you will hear a lot about him, he his actually bridging the ''productivity'' gap between great corns that do not produce much and true commercially viable productivity through low fertilization and no pesticides. He does not know Alan Kapular...God I wish these 2 got together.
Severe, very very severe selection pressure for a decade, like in the ''best 1%'' of multiple acres for each cultivar. I have in my possession corn with 2175 canadian heat units, about 1450 or so american ones, that have 12-14% proteins, as opposed to 7-8 or far less, with 50 pounds per acre of nitrogen, about 25% of the nitrogen they put in conventional agriculture....not bad when you know how important nitrogen is to protein building
Anyway, coming back to heat units, Victor and I will work together from very distant areas, and will use them.
I think we should all do. DTMs are great with small volumes of grains and reliable locally and the natural thing to use for most, but his place, although full of small growers, is not that local anymore.....
Michel
|
|
|
|
Post by ottawagardener on Apr 21, 2011 6:02:20 GMT -5
Hello Michel! Glad that you are keeping busy in a good way. I have always thought of DTM as attempting to roughly estimate heat units so this jives with what I understood.
As always, looking forward to updates.
|
|
|
|
Post by Joseph Lofthouse on Apr 21, 2011 9:33:24 GMT -5
I found this web site helpful. It allowed me to generate a growing degree days chart for a nearby weather station. www.degreedays.net/ It's designed for heating and air conditioning, but it lets me set my own base for the calculations so I chose 50F (10 C). I had to run the calculation as "cooling days", since it is the temperature above 50F that I am interested in. I did a weekly chart for the 2010 growing season. The CSV file that they offer for download was imported into a spreadsheet using comma and tab delimiters. I downloaded daily and weekly data. The weekly data looked like this. Description: Fahrenheit-based cooling degree days for a base temperature of 50F Source: www.degreedays.net (using temperature data from http://www.wunderground.com) Station: Airport: Logan, UT, US (111.85W,41.79N) Station ID: KLGU Week starting CDD 2010-01-03 0 2010-01-10 0 2010-01-17 0 2010-01-24 0 2010-01-31 0 2010-02-07 0 2010-02-14 0 2010-02-21 0 2010-02-28 0 2010-03-07 0 2010-03-14 5 2010-03-21 4 2010-03-28 7 <-- Snow Melted 2010-04-04 4 <-- Received another 12" of snow 2010-04-11 32 2010-04-18 36 2010-04-25 16 2010-05-02 11 2010-05-09 20 2010-05-16 42 2010-05-23 30 <-- My last spring frost 2010-05-30 70 2010-06-06 63 2010-06-13 69 2010-06-20 113 2010-06-27 143 2010-07-04 116 2010-07-11 154 2010-07-18 161 2010-07-25 176 2010-08-01 178 2010-08-08 126 2010-08-15 149 2010-08-22 132 2010-08-29 85 2010-09-05 66 <-- My first fall frost 2010-09-12 100 2010-09-19 84 2010-09-26 113 2010-10-03 58 <-- Hard killing frost 2010-10-10 39 2010-10-17 32 2010-10-24 5 2010-10-31 20 2010-11-07 5 2010-11-14 3 <-- Deep snowcover 2010-11-21 0 2010-11-28 0 2010-12-05 0 2010-12-12 0 2010-12-19 0 2010-12-26 0 Then I can graph that data to see what my season looked like:  And I can also do calculations: For example Painted Mountain flour corn was planted on May 10th, and started silking on July 14th. That is 742 GDD[base 50F] (412 GDD[base 10C]). Calculating GDD would require me to keep more detailed records than what I have been keeping. Not only would I have to document that I planted/harvested corn, I'd have to document the variety and the location so that I could match the data up at the end of the growing season. A notebook in the field would be helpful to me anyway. It seems to me like some plants (garlic, winter wheat) might be better discussed using a different temperature base since they make significant growth at temperatures under base 50F. And since this is a scientific concept and a world-wide forum I am going to repent of my use of degrees F. Any further work I do with this concept will be measured and reported in degrees C. |
|
|
|
Post by Joseph Lofthouse on Apr 21, 2011 10:42:30 GMT -5
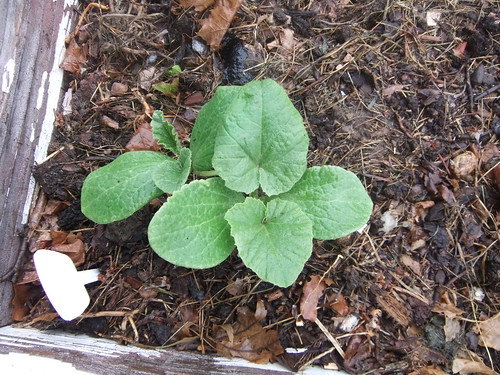
I got curious and dug up some corn seeds from my march planting. I found corn seeds with about 3/4" long roots and shoots. It's still two weeks before I normally plant corn, and the seed has been sitting in cold soil for one month.
It has had 12 GDD(Base 10C).
Or to look at it another way, the seed has endured -157GDD(Base 10C) since it was planted....
It has also endured -6 GDD(Base 0C)
These negative degree days say something about the conditions in my garden since the seed was planted. Could they be useful for measuring the reliability of seed? Or the hardiness of plants? For example for evaluating plants and seeds for tolerance to cold spring weather. Could we rate corn seed based on how many negative growing degree days it can tolerate before it fails to germinate? There'd be a big difference in the rating between Painted Mountain and Sugary Enhanced. I bet that there are even differences among the sugary enhanced corns.
Could we make planting decisions based on GDD... For example brocolli germinates after the growing season has accumulated X GDD, peas germinate after Y GDD, beets after Z GDD, etc...
I make planting recommendations for my neighbors based on apple trees blooming, etc. I bet those could be measured in GDD.
|
|
|
|
Post by keen101 (Biolumo / Andrew B.) on Apr 21, 2011 11:18:12 GMT -5
Interesting stuff. I like the graph. Keep at it, this is a very interesting discussion. One clump of corn has finally broken the surface from when i planted on April 1st. It's been a few days, but i'll just say that it appeared on the 20th. The Weather Report applet on my computer say's it's about 40F. Nighttime lows i think are still in the 30's.
Your graph is actually very close to the weather we got here last spring and summer. I planted the corn on April 1st, they germinated about 2-3 weeks later, and by the time they were 3-4 inches high they got snowed on 4 inches the first or second week of may. I think 3 died, most of the rest survived with half dead leaves, but they recovered and did well.
EDIT: okay 57F now. Highs are supposed be somewhere 50-60's.
|
|
|
|
Post by Joseph Lofthouse on Apr 21, 2011 13:42:38 GMT -5
Then we can do fun things... Like for example I can graph GDD for my farm vs Pekin Indiana the hometown of Astronomy Domine Sweet corn. If it takes 800 GDD:10C to grow the crop then with a May 5th planting date it takes me 14 weeks to accumulate that much growth while it only takes 8 weeks in Pekin.  And we can do speculative what-if calculations... What if using a floating row cover raises the average temperature 1.5 degrees C? That aughta make my harvest about 135 GDD earlier in a 3 month crop, so around 2 weeks earlier. I have noticed that the sunlight reflected from the south side of trees and shrubs warms the micro-environment immediately around them and I get earlier crops there. |
|
|
|
Post by Joseph Lofthouse on Apr 21, 2011 22:58:19 GMT -5
It's raining again so I've had time to play today since it's way too wet to want to plant much. The front-page headline in the local paper today was something like: "Farmer's unable to plant". We are weeks behind on planting this season because we have received around 2X more rain this April than normal. Can't get into the fields to plow or plant because they are too muddy. The reporter was fussing about crop failure since it might be weeks before things dry out. So I compared my growing season with other areas.  |
|
|
|
Post by Joseph Lofthouse on Apr 22, 2011 9:18:17 GMT -5
Is there a generally accepted standard for when to start counting GDD? When the seed is planted? When it sprouts? If not let's adopt a standard for our discussions among ourselves.
|
|
|
|
Post by keen101 (Biolumo / Andrew B.) on Apr 22, 2011 12:24:02 GMT -5
This is the first time i have encountered the term GDD, and had to look it up on wikipedia. Okay so it means Growing Degree Days, which means it's a measure of days able to grow a certain crop based on temperature.
I'm not sure what standard would be best for corn, but i've read most corn germinates at 55F (12.7c). Wikipedia also said that 10c is usually used, so i'm not sure.
|
|
|
|
Post by keen101 (Biolumo / Andrew B.) on Apr 22, 2011 17:18:56 GMT -5
OK, so I'm either really bad at graphing data, or you got completely different numbers  .... 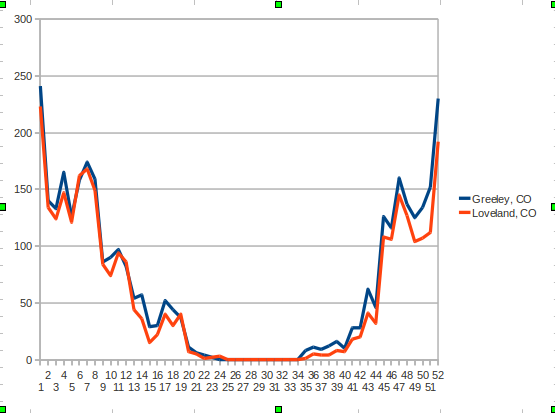 EDIT: okay... i tried downloading the data again, but this time downloading the "cooling degree type" instead of the "heating degree type". I think that's what threw me off. Thanks for that website it looks like a great resource. Here is my second attempt at the graph, and it looks much better. I had to fiddle with the formatting of the x-axis though. I'm still confused at why the GDD data is over 100 and approaching 200, obviously this is not the actual temps from the weather stations? Is there a way to download the actual temps from the weather stations? That data could be useful later in the year. 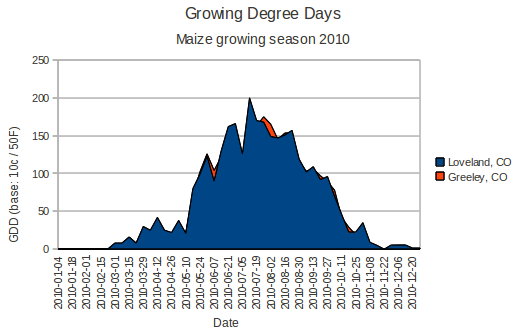 |
|
|
|
Post by Joseph Lofthouse on Apr 22, 2011 22:32:45 GMT -5
keen101: great looking graphs. Yup. Gotta munge the data by selecting "cooling degree days" to convert it for use in the garden. The raw temperature data can be downloaded from wunderground.comGDD is a cumulative addition.... So for the week in which the GDD was ~200, we can divide that by 7 days in a week to get around 29 GDD per day. (I'm assuming that's GDD:50F) We could also download the data for individual days. Then it looks like this:  So what that means in the real world: If the base is 50F, and the low temperature one morning is 50F, and the high that afternoon was 108 then for that day we have added 29 GDD:50F. If each day of the week is somewhat close to that, then by the end of the week we are approaching 200 GDD. |
|
|
|
Post by keen101 (Biolumo / Andrew B.) on Apr 23, 2011 0:56:35 GMT -5
Okay, cool. I'm still wrapping my head around these terms and ideas, but i like where they are headed. So, when you asked about a standard you probably weren't referring to a base temperature, but when to start recording data? If that's the case, then i would say maybe start when most corn seedlings have germinated evenly and appeared with maybe an inch above the ground. Joseph, you mentioned an effort to take more detailed records. What kinds of things are you planning to record? What data needs to be recorded daily to be able to do interesting things with it later? Daytime highs and lows? Nighttime lows? Do those weather stations record both highs and lows? Should i measure the height, and record how fast they grow? I think i'd also like to take measurements on the western rootworm beetles if they appear again. Should i record when i first see them emerge, and record how many i find each day (before attempting to kill or repel them)?  okay i think i ran out of questions. -Andrew |
|
|
|
Post by happyskunk on Apr 23, 2011 3:08:20 GMT -5
Cool graphs!! Thanks for adding Lewiston, ID. Which Lewiston data did you use? Did you use the airport data? I'm closest to the KIDLEWIS4 weather station. I'll have to try and compare the two tomorrow. neat stuff! Now I want to get my own weather station.
|
|
|
|
Post by happyskunk on Apr 23, 2011 3:34:28 GMT -5
Woohoo! I'm at 54.8 GDD (10C base) total on some corn I planted March 17th.
|
|
|
|
Post by Joseph Lofthouse on Apr 23, 2011 9:30:55 GMT -5
In most cases for my graph I used data from the airport closest to the city. If there were multiple airports I just chose one randomly.
I am not currently keeping detailed enough records even to do such simple things as calculate days-to-maturity so that I could stagger planting times to avoid cross pollination on corn. So at a minimum I want to record what I plant and where it's located. And important life cycle milestones... For example during the winter I planted some seeds. I can't tell that if they have germinated. If I had written down what and where I would be able to make the decision easier about whether or not to till the spot and start over.
I bet there are lots of bugs whose life cycles could be predicted with GDD if we paid attention. GDD is calculated using the high and the low temperature for the day. Most every weather station keeps that data.
|
|


 ....
....  okay i think i ran out of questions.